|
DCDT+
What is DCDT+?
DCDT+
is a Windows® program for analysis of sedimentation
velocity (SV) data that implements the dc/dt method originally developed by
Walter Stafford, and also implements fitting of the derived g(s*) distributions as
a mixture containing of up to 5 discrete (non-interacting) species. It has been
used to analyze data for nearly 300 publications.The program is designed to be very easy
to use, even for novices, yet it also offers many options for the 'power user' when they are needed.
It uses multi-page analysis 'documents' and a familiar user interface with
toolbars and buttons, making it similar to other Windows programs to reduce the
learning curve. It also
incorporates a number of intelligent 'wizards' that automatically accomplish
tasks such as locating the meniscus position, removal of systematic noise
("jitter") and
fringe jumps from interference scans, and even selection of which scans should
be used for analysis.
This is not a package that tries to do everything---its purpose is to
implement one particular approach, do that very well and very easily, and do it
in a highly reproducible and well-documented manner.
The success of this approach is demonstrated by its use in
200+ publications. More significantly, many
of these are from intermittent or casual users of AUC, proving you don't have to
devote years to learning data analysis to successfully answer important research
questions with SV.
The program is now distributed as "freeware" and requires no
registration. The only restriction
is that it cannot be sold or packaged with other commercial software. The author
asks only that you cite it properly when publishing your analyzed results.
Unique features:
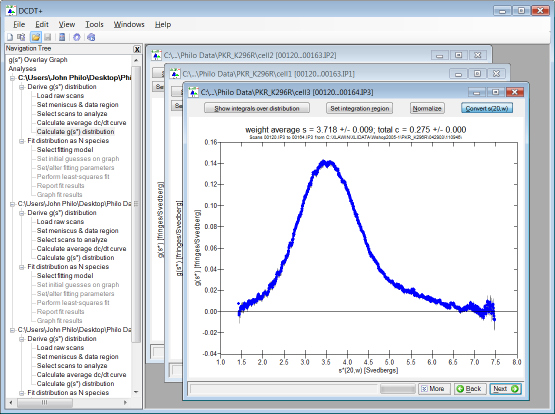
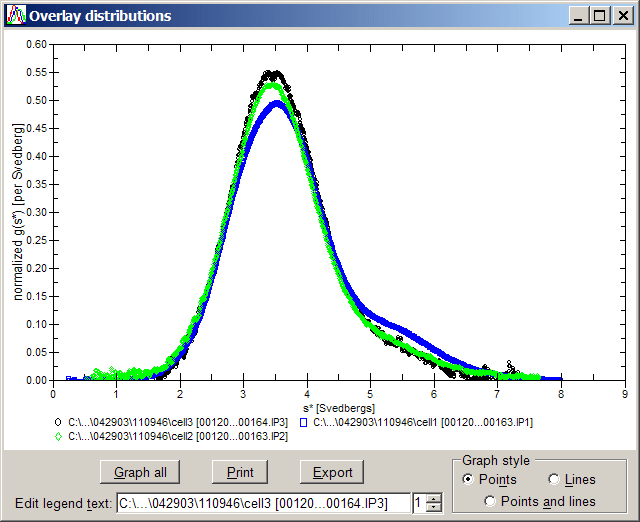
 | Modern multi-document, Explorer-style user interface
 | multiple analyses can be open simultaneously, and their g(s*)
distributions are automatically incorporated into an overlay graph [example
below] |
|
| Explorer-like navigation tree to move to specific analysis pages
(analysis steps) and between analysis documents |
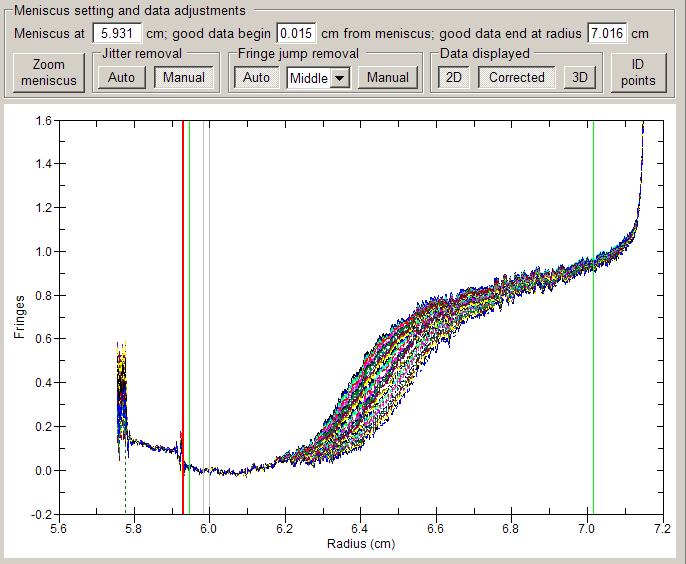
| click-and-drag setting of meniscus marker, data limits, peak limits
etc. [see image below] |
| New algorithm for fitting of g(s*) distributions or dc/dt
curves as mixtures gives s, D, and M values for each
species with theoretical accuracy of better than 0.1%, independent of the
number of scans used in the analysis |
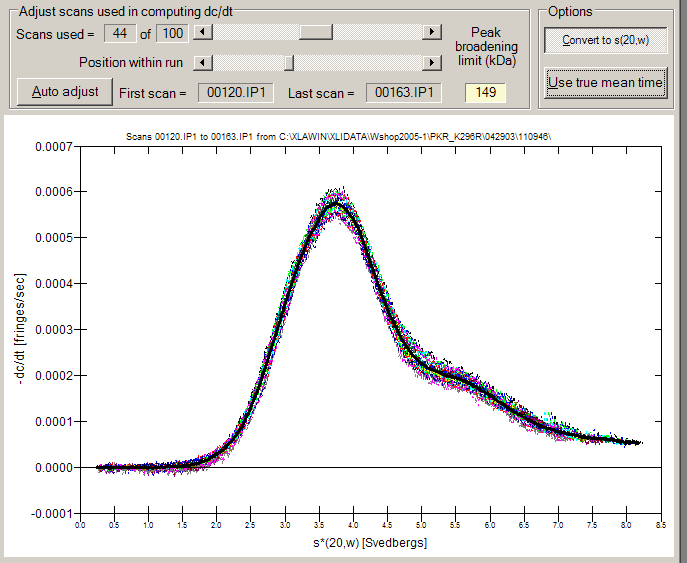
| Load the entire run and then use scroll bars to select the subset of scans
to be analyzed (or just let the program wizard do it for you) [see image
below] |
| Optionally normalizes g(s*) distributions to allow easy comparisons
of samples at different concentrations (a great diagnostic to distinguish
interacting systems from mixtures, as in example shown 3 pictures above) |
| 'Standard' program mode alters user interface to hide options you probably don't need; 'Advanced'
mode provides more options to power users |
| Program wizards automatically accomplish many tasks
| Once scans are loaded, you can can calculate the g(s*)
distribution and go all the way to a completed fit as a single species
simply by repeatedly hitting the Enter key to accept the wizards' default choices |
|
| New! Generates a log file that records every step of the data analysis, every
option selected, every intermediate fitting result (including a table and
graph), when it was done, and by whom (for computers with authenticated log-in
servers) |
| Evaluates fitted parameter confidence
intervals using any of three orthogonal approaches: F statistics, the
bootstrap method, or a Monte Carlo algorithm that puts the random noise in the
theoretical scans [to eliminate any concerns about effects of the
transformation to g(s*)] |
| True local Help file to give context-sensitive Help for each dialog
box or control, with extensive tutorials and a searchable index. (A PDF file
to print a user manual is also available to registered users) |
| Generates nicely formatted printed
reports with tables, and which document every factor that influences the
results. These reports (with graphs) can be pasted into your word processor or electronic
lab notebook |
| Saved analysis documents record every parameter, including the raw data,
in a single file
so you can re-load your analysis back to exactly the same state
| Analysis documents appear in your 'My Recent Documents' folder, just
like your other documents |
|
| Creates 9 types of publication-quality graphs of fit results |
DCDT+ is used by more than 100 laboratories around the world (partial list here).
back to top
How does DCDT+
differ from the ORIGIN® version of DCDT supplied by Beckman
Coulter?
| DCDT+
provides correct values of D and M from fitting the
g(s*) distributions
|
the Beckman implementations (even the newest Origin 6 versions)
contain
an error in converting the width of the fitted Gaussians to diffusion coefficients;
the returned D and M values are never accurate |
|
| Just load the entire run in one operation and then select which scans to analyze
using slider controls
|
no more struggling to figure out which scans to load and analyze |
|
| DCDT+
provides a quick test for whether you are broadening the curves by including
too many scans
|
get the best signal/noise possible
without hoping and guessing about when you are averaging too many scans
or struggling with cumbersome manual calculations |
|
|
standard errors or confidence intervals are calculated for all fitted parameters
|
what good are fitting results if you
don't know the uncertainty in the values returned? |
|
| DCDT+ comes with a comprehensive, local
context-sensitive Help file and optional printed manual
|
includes step-by-step tutorials, tips, "how-to"
guides, frequently-asked questions, a searchable index, and images of all
forms |
|
| full reports of analyses are provided for documented, reproducible results |
|
sedimentation coefficients can be internally converted to s20,w values |
| DCDT+
provides a unique option of fitting to dc/dt curves, giving improved
accuracy and improved resolution of multiple species in some cases |
| DCDT+ shows you the dc/dt curves for every individual scan pair so you
can identify abnormal interference scans (outliers) before you unknowingly
include them in your analyses
|
bad scans can be removed from the analysis without
starting over and reloading all the scans |
|
| reproducible setting of the meniscus position
|
no more struggling with the Origin® data marker
and a tiny graph |
|
| results from fits give true molecular masses for any value of v-bar and density
|
no more cumbersome manual calculations |
|
| when the zero of the dc/dt curves is manually adjusted, that fact and the amount of the adjustment is documented in fit reports
|
what good are results that can't be documented or reproduced? |
|
| during multi-species fits the masses and/or sedimentation coefficients
can be constrained to ratios appropriate for small oligomers |
| includes
a Claverie finite-element velocity experiment simulator for "what-if" testing
and self-teaching |
|
unique option of using an alternative algorithm for calculating g(s*)
distributions that works better than the standard Stafford algorithm when the
time span of the scans grows long |
| computes
the number-, weight-, z-, and z+1-average sedimentation coefficients and total concentration
from both the g(s*) and g^(s*) distributions, with error
bars for all these values |
| handles
an unlimited number scans (up to available memory), not just 40 |
| computes
and displays g^(s*) (g-hat), the distribution that should be used
when studying interacting systems, as well as g(s*) |
back to top
How does DCDT+
differ from the ls-g(s) or c(s) methods in Peter Schuck's SEDFIT?
|
The ls-g(s) distributions derived by SEDFIT are
equivalent to the g(s*) distributions derived via the DCDT method only
when the time span of the scans used in either method is small (a small number
of scans). As the time span grows larger they become non-equivalent, and for
ls-g(s) there is no longer any direct theoretical relationship between
the width of a peak and the diffusion coefficient (or mass) of that species as
there is for g(s*). |
|
For g(s*) derived via the DCDT method the removal of
baseline noise (time-independent noise) and interference 'jitter' (radially-independent
noise) is done via simple arithmetic and is model-independent. For ls-g(s) and
c(s) the removal of this systematic noise is model-dependent. |
|
For c(s) distributions the diffusion information is
essentially removed, which enhances the resolution for mixtures. The peak widths in c(s) are a function of
signal/noise ratio and regularization parameters; they have no physical
meaning. |
|
False peaks are often generated if the ls-g(s) method
is applied to scans encompassing a large fraction of the run, especially for samples where
diffusion is significant (conditions where it does not provide a good fit of
the raw data). The c(s) method also generates false peaks if not used
very carefully or whenever it cannot generate a good fit of the raw data.
The dc/dt method never generates false peaks. |
|
Fitting of ls-g(s) distributions to one or more peaks is
not implemented in SEDFIT; peak fitting makes no sense for c(s)
distributions |
|
Neither ls-g(s) nor c(s) provides error bars for
the distributions or properties of individual peaks |
|
SEDFIT does not provide reports, and does not store the
analysis in a file so it can be re-opened |
|
SEDFIT cannot have multiple analyses open at the same time,
and cannot overlay ls-g(s) or c(s) distributions from different
samples |
|
SEDFIT does not have a local context-sensitive
Help file with searchable index, or offer a printed manual |
back to top
System Requirements
SVEDBERG 7 runs under Windows XP, Vista, 7, 8, or 10. Use via
Windows dual-boot configurations on MacIntosh systems usually works fine, but is
not officially supported or guaranteed.
This program also requires the Microsoft .NET framework to be present on the
computer. This is usually already true for newer computers. If it is not
already present, this is detected during installation and a link is given so it can be
downloaded from Microsoft and installed.
Although DCDT+
will run correctly at a 640x480 (VGA) video resolution, a resolution of
1024 x 768 or higher is highly recommended.
The program requires approximately 8 MBytes of disk space (most of which is
for the comprehensive Help file).
back
to top
How should I cite this program?
- The primary citation for this program is
| Philo,
J. S. (2006). Improved methods for fitting sedimentation coefficient
distributions derived by time-derivative techniques. Anal.
Biochem.
354, 238-246. |
- Because the original development of the dc/dt method was by
Walter Stafford, please always also cite Walter Stafford's original
paper:
| Stafford, W.F., III. 1992. Boundary analysis in sedimentation transport
experiments: A procedure for obtaining sedimentation coefficient
distributions using the time derivative of the concentration profile.
Analytical Biochemistry 203:295-301. |
- The program itself should be mentioned in your Methods section as
DCDT+ by John Philo,
with the version number.
Specialized method citations
The reference for the special
multi-segment dc/dt calculations is
| Philo, J.
S. (2011). Limiting the sedimentation coefficient range for sedimentation
velocity data analysis: Partial boundary modeling and g(s*) approaches
revisited. Anal.
Biochem.
412, 189-202. |
The reference for
fitting to dc/dt data rather than g(s*), and for the
Use true mean time button (the 'broad algorithm') is:
| Philo,
J.S. (2000) A method for directly fitting the time derivative of sedimentation
velocity data and an alternative algorithm for calculating sedimentation
coefficient distribution functions. Analytical Biochemistry, 279,
151-163. |
|